Figure 1.
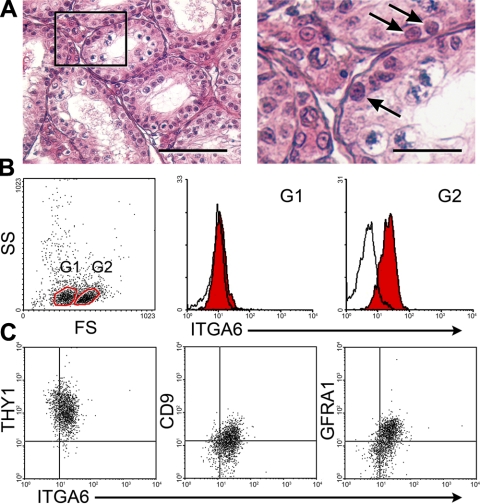
Analysis of rabbit spermatogonia. A) Histological examination of a 15-wk-old prepubertal rabbit testis. Left panel: no spermatids were found in the seminiferous tubules. Right panel: enlarged image of the boxed area in left panel. Arrows indicate spermatogonia. Scale bars = 50 μm (left panel); 15 μm (right panel). B) Flow cytometric analysis of testicular cells isolated from 15-wk-old rabbit testes. Gate 1 (G1) and gate 2 (G2) were created by analysis of forward scatter (FS) and side scatter (SS). Cells in G1 were FSlo ITGA6−; cells in G2 were FShi ITGA6+. C) Flow cytometric analysis of G2 cells of panel B. FShi ITGA6+ cells expressed THY1, CD9, and GFRA1. Proportions of ITGA6+ THY1+, ITGA6+ CD9+, and ITGA6+ GFRA1+ cell fractions in the total cells analyzed were 25, 11, and 17%, respectively. The x and y axes depict the relative fluorescence intensity of individual cells.

