Figure 8.
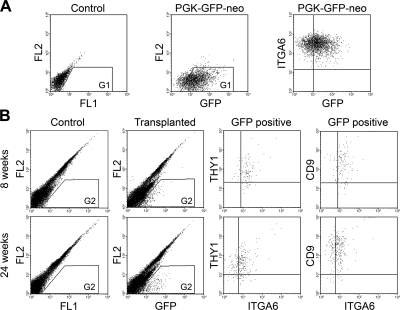
Phenotypic characterization of RCFG cells transplanted into mouse testes. A) A GFP reporter gene expression construct was introduced into RCFG cells using a lentiviral vector. After antibiotic selection, GFP expression in RCFG cells was confirmed using flow cytometry. Left panel: data from nontransduced control cells. Middle panel: data from lentivirus-transduced RCFG cells (PGK-GFP-neo). GFP signal was detected by 2-dimensional dot-plot analyses using FL1 (x axis) and FL2 (y axis), which is representative of the 530/30 and 585/42 bandpass filters, respectively, on the fluorescence detector. Proportion of G1 cells is 83%. Right panel: ITGA6 expression pattern of GFP-expressing RCFG cells. Lentivirus-transduced RCFG cells were stained with a PE-conjugated anti-ITGA6 antibody. B) GFP-expressing RCFG cells were transplanted into busulfan-treated immunodeficient mice. A single-cell suspension was prepared from recipient testes at the indicated time points after transplantation and stained with anti-ITGA6 and anti-THY1 or anti-CD9 antibodies for flow cytometric analyses. GFP+ donor RCFG cells were identified in the recipient testicular cell suspension (transplanted, G2). GFP signal was detected as in A. Data from busulfan-treated nontransplanted testicular cells are shown (control, G2). Proportion of G2 in transplanted testes at 8 and 24 wk after transplantation was 1.0 and 1.1%, respectively. GFP+ donor RCFG cells identified in the recipient testes were THY1+ ITGA6+ CD9+ (GFP+). The x and y axes depict the relative fluorescence intensity of individual cells.

