Figure 1.
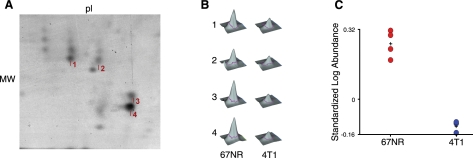
DIGE of NGP in MDSC lysates. Purified Gr1+/CD11b+ MDSCs isolated from spleen of mice bearing 4T1 tumors and 67NR tumors were analyzed by 2-dimensional gel electrophoresis. A) Representative image of a Sypro ruby-stained replicate gel for the migratory region of NGP. Protein spots 1–4 represent the NGP protein in the range of ∼20 kDa and pI ∼5. B) Peak intensity illustrations of peptide AIEAYNQGR from NGP isolated from 4 comigrating spots indicated in A. C) Graphical representation of the standardized log abundance of NGP protein spots 1–4 indicated inA. P = 0.000028 by Student's t test; P = 0.0014 with Benjamini-Hochberg false discovery rate correction. MDSC cell lysates were pooled from 6–7 mice/group and analyzed with 4 replicate gels.

