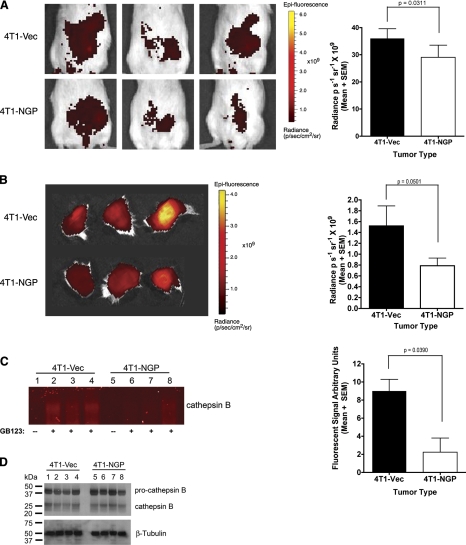
Figure 7.
NGP inhibits cathepsin activity in vivo. A) Mice bearing size-matched 4T1 tumors were injected intravenously with probe GB123 at 18 h prior to in vivo imaging. Left panels: representative images. Right panel: photon intensity quantitation. P = 0.0311; t test. B) Left panel: whole tumors were removed surgically and imaged for cathepsin activity by GB123 probe intensity. Right panel: quantification of data. P = 0.05; t test. C) Left panel: equal amounts of total protein from tumor lysates were separated by PAGE; probe fluorescence at cathepsin B molecular weight was visualized on a flatbed scanner. Lane 1–4: 4T1-Vec, lane 1 without probe and lanes 2–4 with probe; lanes 5–8: 4T1-NGP, lane 5 without probe and lanes 6–8 with probe. Right panel: intensities of the labeled bands were quantified and plotted as means ± se. P = 0.039; t test. D) Protein samples identical to those in C were analyzed by Western blot for cathepsin B protein. β-Tubulin was used as a loading control. Each analysis utilized size-matched tumors from 3 mice/group.

