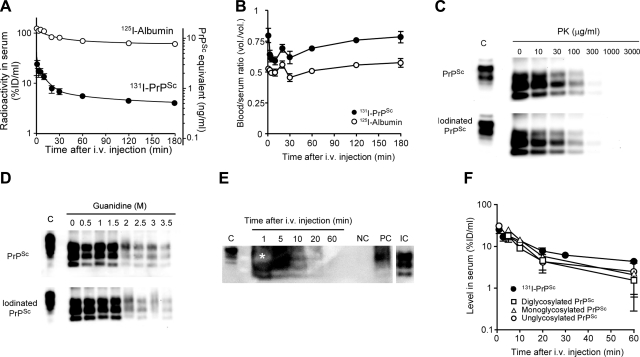
Figure 2.
Pharmacokinetics of PrPSc after i.v. injection in mice. A, B) Serum concentration time curves (A) and whole-blood/serum ratios (B) were estimated after injection of [131I]PrPSc and [125I]albumin in wild-type mice. Mice received [131I]PrPSc (1×10⁶ cpm) and [125I]albumin (5×10⁵ cpm) intravenously and were then killed at various time points (1–180 min after injection). Points represent mean ± se of 3–5 mice. C, D) Biochemical properties of iodinated PrPSc compared to noniodinated protein were studied by PK sensitivity (C) and conformational stability tested by guanidine denaturation (D). Highly purified PrPSc, either iodinated or noniodinated, was used. All samples were treated with PK, except the normal brain homogenate that was used to mark the electrophoretical migration of full-length PrPC. Pharmacokinetic studies were also carried out using partially purified, full-length, unlabeled PrPSc. E) PrPSc was detected in serum by Western blot using 6D11 antibody (1:5000). Lane NC (negative control) represents serum from a control animal that was injected with buffer. Lane PC (positive control) corresponds to normal serum spiked with partially purified PrPSc, which was subjected to the same processing as the experimental samples. Lane IC (input control) represents partially purified PrPSc sample used to inject the animals (1:250 dilution of amount injected). Lanes 1, 5, 10, 20, and 60 represent representative results of serum from animals injected with partially purified PrPSc, which were killed at the respective times. Asterisk indicates an oversaturated band. Mice received i.v. full-length PrPSc at the dose of 1 brain equivalent of the brain of RML-infected animals. All samples were treated with PK before Western blot, except the normal brain homogenate that was used to mark the electrophoretical migration of full-length PrPC. F) Western blot results were quantitated by densitometry, using blots with different exposition to accurately estimate oversaturated and very faint signals. Quantity of each glycosylation form in serum was estimated independently and plotted together with the data obtained by using radiolabeled PrPSc. Points represent means ± se of 2–3 mice.

