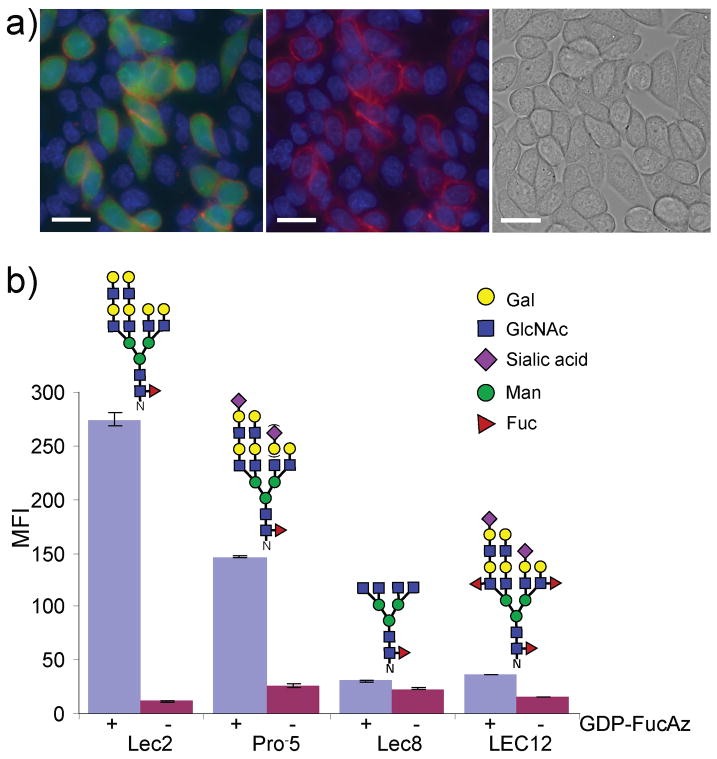
Figure 3.
Tracking of glycans with LacNAc on CHO glycosylation mutants. a) Imaging cell-surface glycans with LacNAc. Lec2 cells stained with CMFDA (fluorescein, green) and unstained Lec8 cells were mixed at a 1:5 ratio and were cultured for 3 days. The cells were treated with 500 μM GDP-FucAz and 30 mU α(1,3)FucT-M for 15 min, then labeled with 20 μM DIFO-647 for 25 min. The Alexa Fluor 647 image merged with the fluorescein and Hoechst 33342 images (left); the Alexa Fluor 647 image merged with the Hoechst 33342 image (middle); the bright field image (right). Scale bar: 20 μm. b) wild-type CHO, and mutant Lec2, Lec8, and LEC12 CHO cells were treated with 500 μM GDP-FucAz in the presence of 30 mU α(1,3)FucT-M for 10 min, then labeled with 10 μM BARAC-biotin for 10 min. The labeled cells were then probed with streptavidin-Alexa Fluor 488. Error bars represent the standard deviation of three replicates. The N-glycan shown above each cell line is representative of major N-glycans produced.[15]

