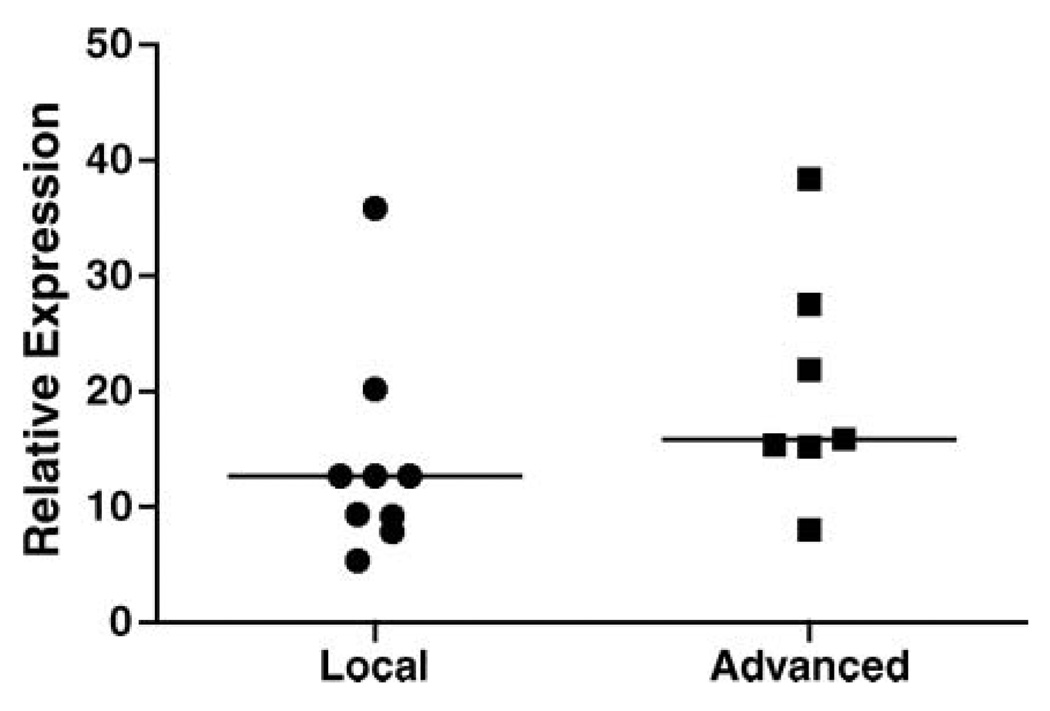
Figure 3.
Comparison of thrombin mRNA expression between local (N = 9) and advanced (N = 7) prostate cancer specimens. Median levels (line) were not significantly different between groups (p = .09, Mann–Whitney test). Expression was measured by quantitative real-time PCR. Expression was calculated using standard curves and normalized using 18s rRNA as a control.

