Figure 2.

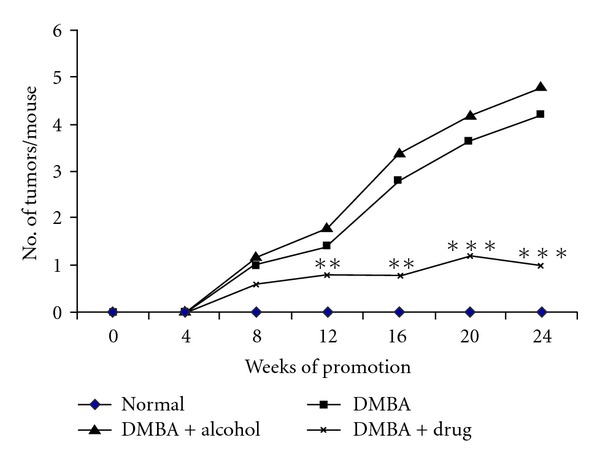
Number of tumors/mouse plotted as a function of weeks on test. Each value represents the mean number of tumor per mouse. **P < .01, ***P < .001.

Number of tumors/mouse plotted as a function of weeks on test. Each value represents the mean number of tumor per mouse. **P < .01, ***P < .001.