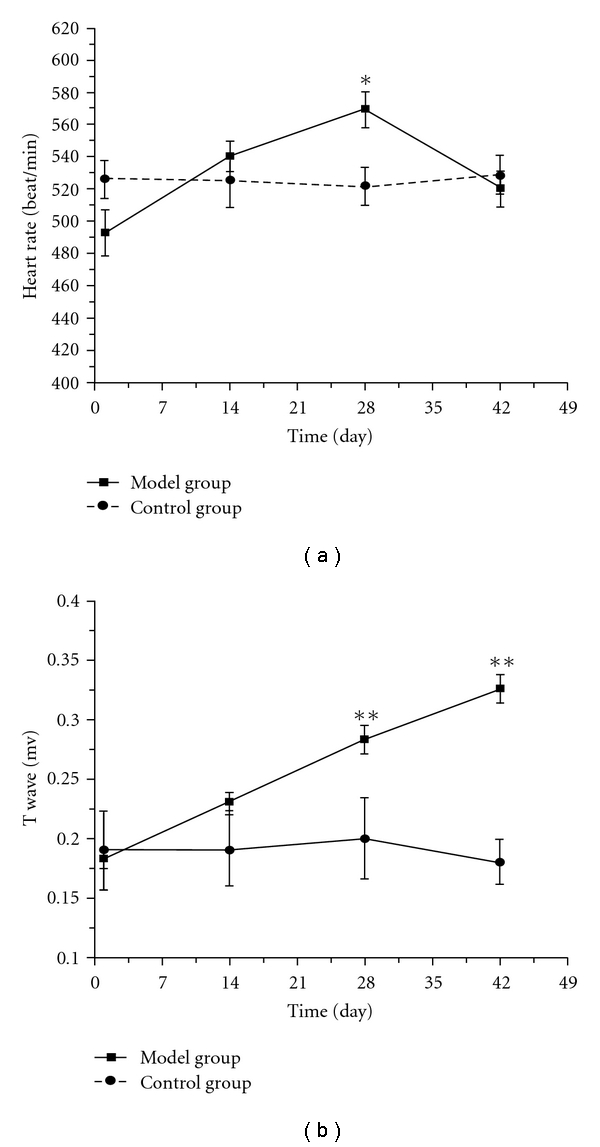
Figure 3.

The time-course changes of heart rate (a), and T wave (b) in mice exposed to chronic intermittent hypoxia. Each value represents the mean ± SEM. Significance was evaluated with one-way repeated measures of ANOVA. *P < .05, **P < .01, compared with the self-control group.
