Figure 4.

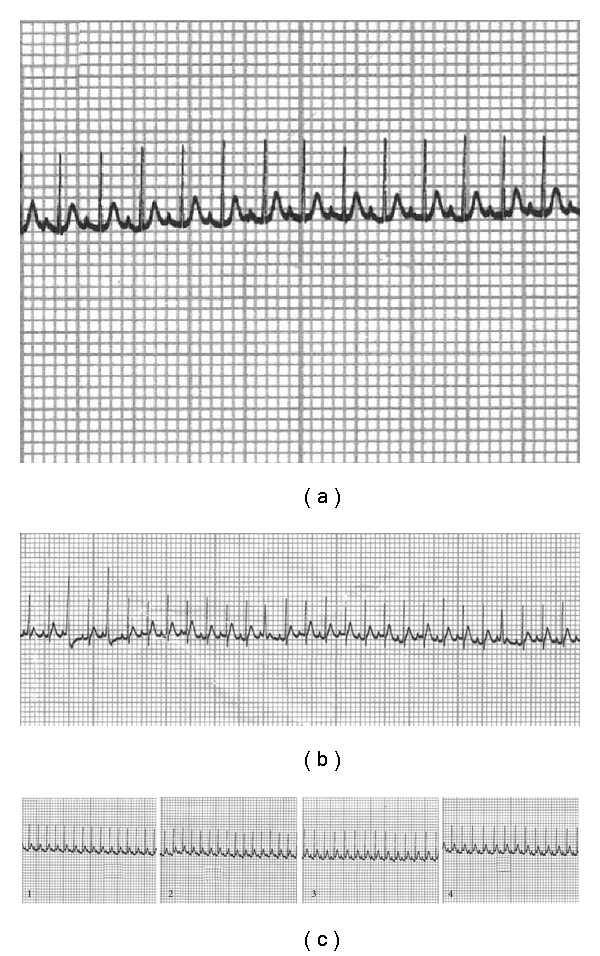
Normal electrocardiogram (a), premature beat (b), and T wave elevation (c) during experiment (1, 2, 3 and 4 were recorded on days 1, 14, 28 and 42 of experiment, resp.).

Normal electrocardiogram (a), premature beat (b), and T wave elevation (c) during experiment (1, 2, 3 and 4 were recorded on days 1, 14, 28 and 42 of experiment, resp.).