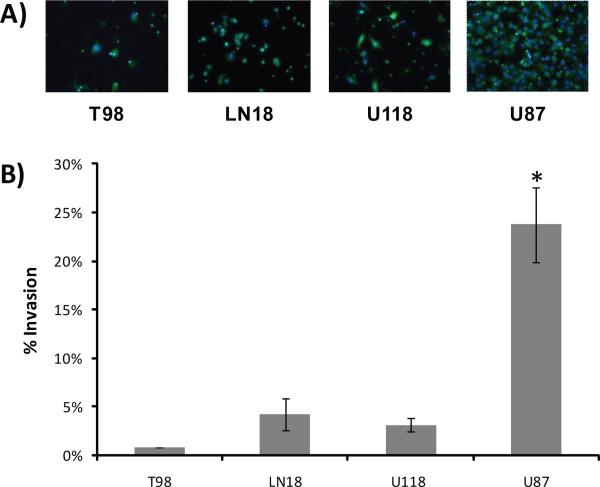
Figure 1. Matrigel invasion assay of glioblastoma cell lines.
A) Fluorescent images (20×) of cells that invaded through the Matrigel-coated Boyden chamber after twelve hours of incubation. Cytosol = green/calcein AM; Nucleus = blue/Hoescht 33342. B) Percent invasion of cells (average invasive cells per field normalized to average number of total invasive plus noninvasive cells per field). Data are reported as mean values (± SD) of at least three replicates for each cell line. * Student-Newman-Keuls p<0.05.

