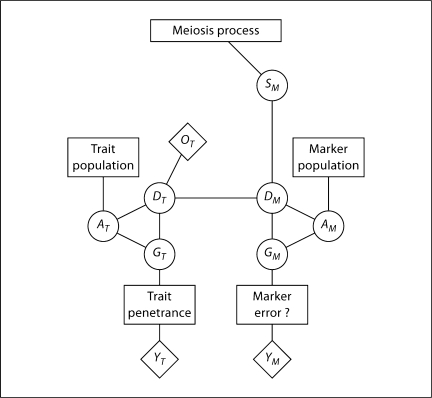
Fig. 6.
Structure of genetic data with modern dense SNP marker data (M) for analysis of trait data T. The right half of the figure shows the structure for realization of ibd graphs (DM at marker locations, conditional on all marker data. The left part shows the structure for analysis of trait data, using the realized (DM (see text for details).

