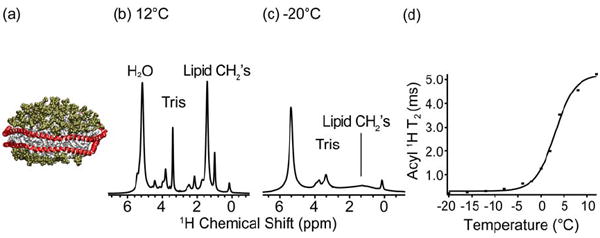
Figure 1. Gel to liquid crystalline transition of lipids in Nanodiscs.

(a) A cartoon representation of a Nanodisc with MSP1D1 in red and POPC headgroups in green and tails in white. 1H 1D spectra of POPC Nanodiscs at (b) 12 °C and (c) -20 °C. Spectra were acquired on a 600 MHz (1H frequency) spectrometer. The acyl 1H linewidth and peak height indicates the phase transition. (d) Graph of T2 values as a function of temperature for the acyl methylene 1H signals (1.3 ppm). The lipid phase transition in POPC Nanodiscs is determined to be at +3 °C.
