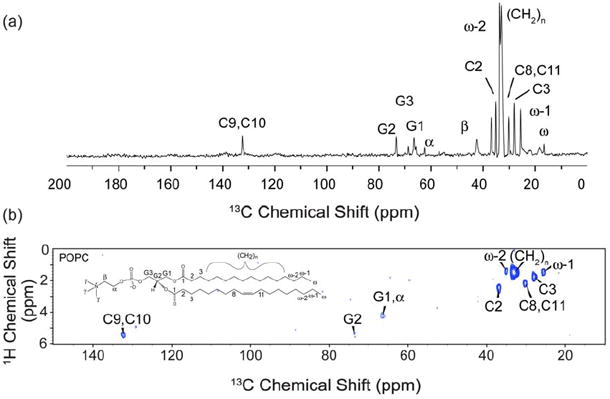
Figure 3. 13C 1D and 1H-13C 2D spectra of POPC bilayer in a Nanodisc.

(a) 1D 13C spectrum of Nanodiscs with uniformly-13C,15N-labeled MSP1D1 and natural abundance POPC lipids at 8 °C on a 600 MHz (1H frequency) spectrometer. The lipid spectrum was acquired with a 1 ms T2 filter, no 1H-1H mixing and 0.4 ms 1H-13C contact time. The data was processed with 25 Hz Lorentzian-to-Gaussian line-broadening. (b) 1H-13C 2D spectrum of the same sample acquired under the same conditions for 6.5 hrs, with a schematic of a POPC lipid molecule. The spectrum was processed with 100 Hz of Lorentzian-to-Gaussian line broadening in each dimension.
