
Figure 6. 1H-13C-13C 3D spectrum of MSP1D1 in Nanodiscs.
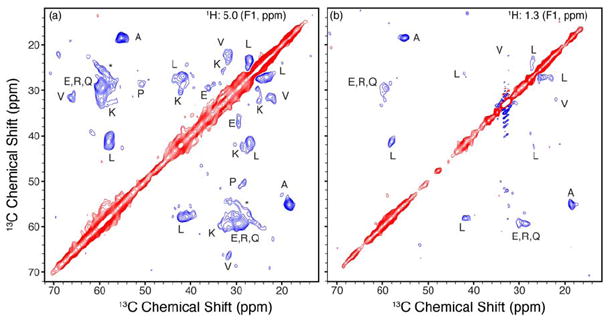
1H-13C-13C spectrum acquired at 600 MHz (1H frequency), 8 °C sample temp in ~115 hours. The T2 filter time was set to 1 ms to eliminate protein 1H polarization. A 1H-1H mixing time of 30 ms was used followed by 1H-13C cross polariation. 13C-13C mixing with 12 ms of SPC-5 was used without the double quantum filiter. Water (a) and lipid (b) 13C-13C planes are show with peaks labeled by amino acid type (88). Positive contours shown in red, negative in blue. The seeming artifact in the lipid plane is due to a strong signal originating from lipids correlated to themselves.