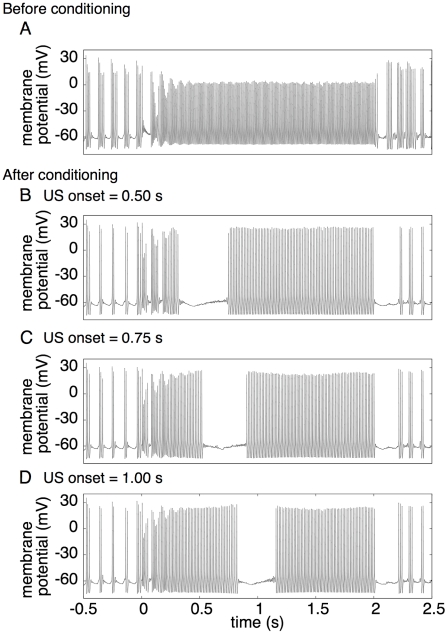
Figure 10. Membrane potential of a model PC in the simulation of delay eyelid conditioning.
A, Time evolution of membrane potential before conditioning. The abscissa indicates time from the CS onset. B, C and D, Time evolutions of membrane potential after conditioning in the cases where the US onset was set at 0.5, 0.75 and 1.0 s, respectively. The model PC learned to stop firing 100–200 ms earlier than the US onset for each conditioning.

