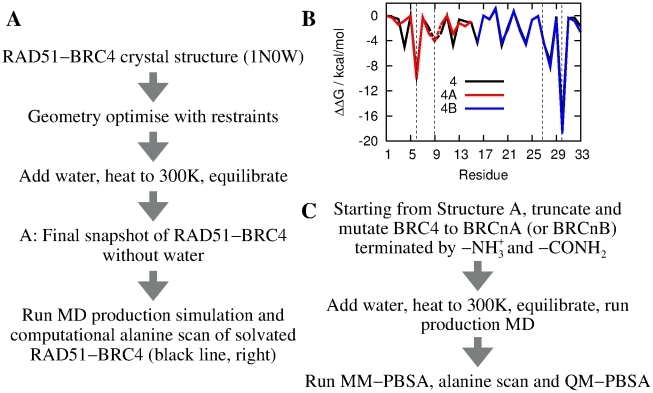
Figure 2. Computational alanine scanning mutagenesis identifies two binding hotspots in BRC4.
a) Procedure for the MD simulations starting from the RAD51-BRC4 X-ray crystal structure. b) Computational alanine mutagenesis scan of the RAD51-BRC4 complex. Dashed lines indicate an alanine to glycine mutation. The two interaction hotspots (“FHTA” and “LFDE”) are denoted by vertical dashed lines and contribute significantly to the total free energy of binding. Alanine scans from separate RAD51-BRC4A and RAD51-BRC4B complexes are also shown and reproduce the behaviour of the full-length peptide (see next section). c) Simulation outline describing the generation of the eight RAD51-BRCnA structures from a snapshot of the RAD51-BRC4 MD simulation (Structure A).

