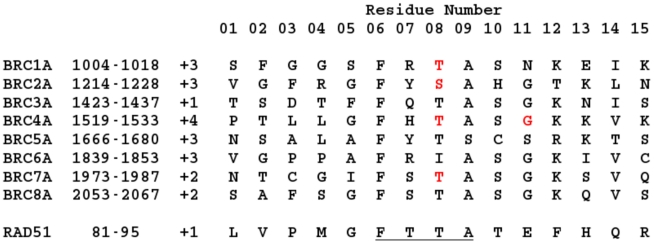
Figure 3. Sequence alignment of the  loop regions.
Shown are the eight human BRC repeats used in the computational simulations, as well as the 15 residues of the ligand at the RAD51-RAD51 self-oligomerisation interface. BRCA2 residue numbering is shown in column two, but for simplicity, residues will be labelled 01-15 throughout this paper. The FxxA hotspot is underlined, net charges of each ligand are shown in column three as multiples of the electronic charge and sites of mutations studied here are highlighted in red.

