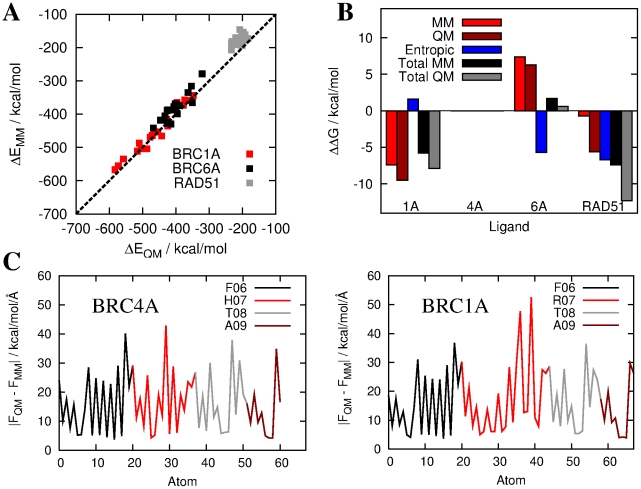
Figure 6. Results of QM-PBSA analysis of the RAD51-BRCnA complexes.
a) Correlation between the QM and MM total gas phase binding energies for the complexes between RAD51 and BRC1A, BRC6A and RAD51. b) Contributions to the free energy of binding (relative to RAD51-BRC4A) in MM-PBSA and QM-PBSA. Similar relative binding affinities are observed in MM-PBSA and QM-PBSA. c) Magnitude of the vector force errors on atoms of the ligand in the “FxxA” hotspot region from simulations of the RAD51-BRC4A and RAD51-BRC1A complexes.

