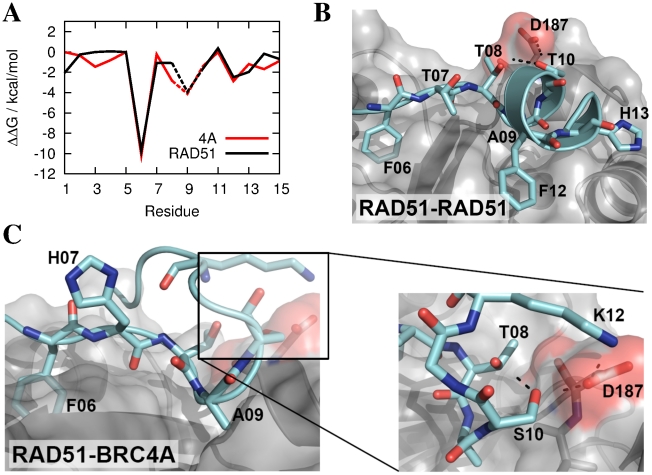
Figure 7. MD simulations of the RAD51-RAD51 and RAD51-BRC4A complexes.
a) Computational alanine scan, comparing contributions of each residue to binding, reveals a similar interaction pattern in the RAD51-RAD51 dimer to that of its antagonist, BRC4A. Dashed lines indicate an alanine to glycine mutation. b) Snapshot of the RAD51-RAD51 complex in the region of the interaction hotspot. The RAD51 receptor is shown in silver and significant hydrogen bonds as dashed lines. c) Snapshot of the RAD51-BRC4A interaction from MD simulation and close up of the four-way interaction between T08, S10, K12 of BRC4A and D187 of RAD51.

