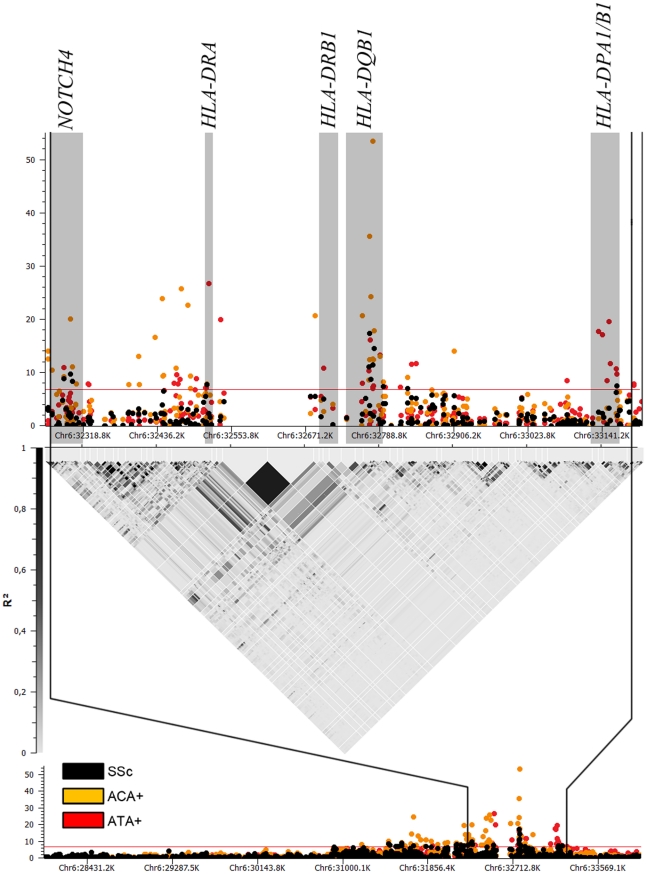
Figure 2. Manhattan plot showing the -log10 of the Mantel-Haenszel P value of all 1,112 SNPs in HLA region for the GWAS cohorts comprising 2,296 cases and 5,171 controls.
Associations for the whole SSc set are in black, while associations in ACA (760 cases) and ATA (447 cases) positive subgroups are in orange and red, respectively. Loci which were independently associated according to conditional logistic regression analysis are highlighted in grey.

