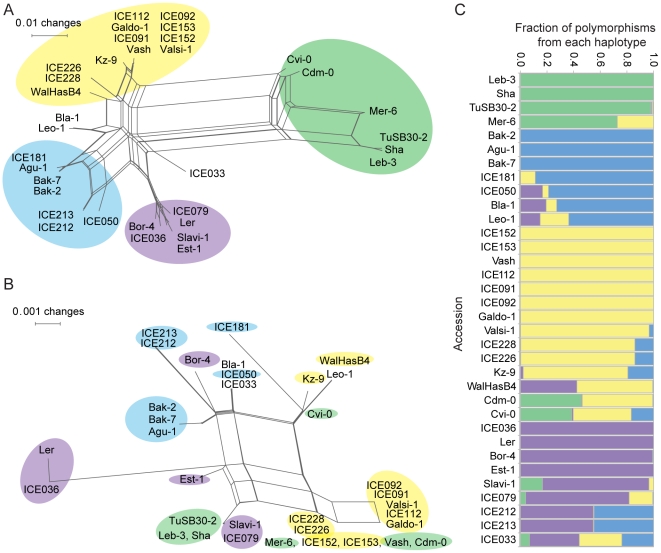
Figure 6. Phylogenetic analysis of OAK from multiple accessions.
Splitstree [45] was used to examine the phylogenetic relationship of OAK from 34 accessions based on (a) 1,540 bp coding sequences downstream of the translational start site or (b) 1,196 bp promoter sequence. Color code in (b) reflects cluster membership in (a), highlighting variable correlation between promoter and coding region similarity. (c) STRUCTURE analysis [46] of haplotype contributions to each accession based on promoter and coding regions.

