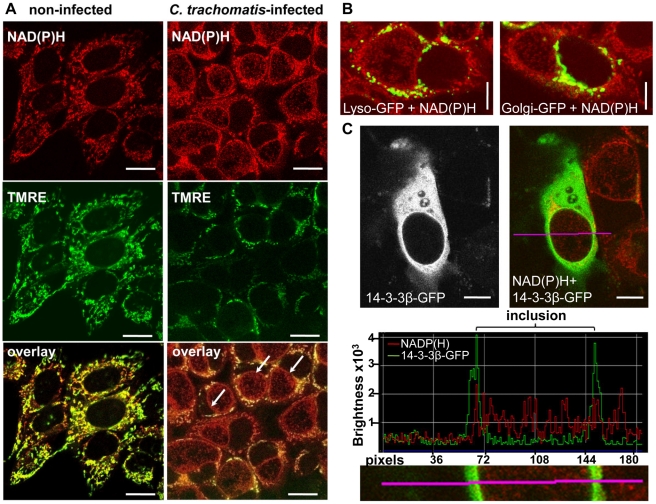
Figure 2. Non-mitochondrial NAD(P)H fluorescence in C. trachomatis-infected cells.
(A) In non-infected HEp-2 cells (left panels), the mitochondria marker TMRE (middle panels; fluorescence emission between 580–680 nm, depicted in green) co-localizes (lower panels) with the high intensity NADP(H) fluorescence signal (upper panels; fluorescence emission between 450–500 nm, depicted in red). In C. trachomatis-infected cells (24 hpi, right panels), the arrows point to high intensity non-mitochondrial NAD(P)H signals of the chlamydial-inclusions. TMRE and NAD(P)H were excited at 730 nm (scale bar = 20 µm). (B) CellLight Lysosomes-GFP (left panel) and CellLight Golgi-GFP (right panel) did not co-localize with NAD(P)H autofluorescence in C. trachomatis-infected cells at 24 hpi. GFP was excited at 840 nm and NAD(P)H was excited at 730 nm. Pictures are overlays of pseudocolor images (GFP = green, NAD(P)H = red; scale bar = 10 µm). (C) Overexpressed 14-3-3β-GFP protein co-localized with the NAD(P)H autofluorescence in C. trachomatis-infected cells at 24 hpi. 14-3-3β-GFP showed increased fluorescence at the chlamydial inclusion membrane (left panels). Pseudocolor image (right panel) of NAD(P)H fluorescence (excited at 730 nm, red) and GFP fluorescence (excited at 840 nm, green) shows the overlay. The fluorescence intensity profile (middle panel) of the line indicated in the original and in the magnified picture (lower panel) confirm the co-localization of 14-3-3β-GFP and NAD(P)H fluorescence at the chlamydial inclusion membrane (scale bar = 10 µm).

