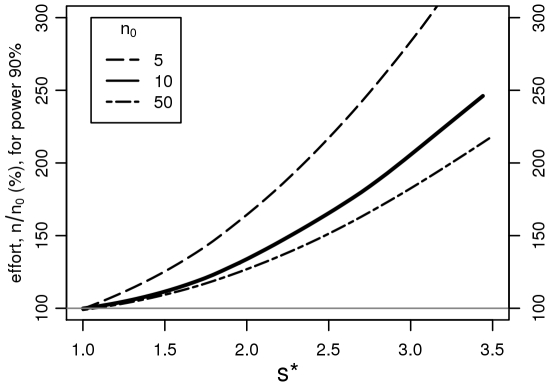
Figure 2. Savings in sample size.
If the t-test, which is based on the normal distribution, is applied to (skewed) raw data, the statistical power is lower than for the optimal procedure, which consists of applying it to the log transformed values. Starting from 2 groups of log-normal data with a given s*, we calculate the sample size needed in each group to achieve the same (simulated) statistical power with the (inappropriate) t-test applied to the raw data as with the optimal test, applied to n0 = 5, 10, and 50 observations in each group. This sample size is a function of s*. For the median skewness, s* = 2.4, 16 observations are needed instead of 10, corresponding to 60% additional effort.

