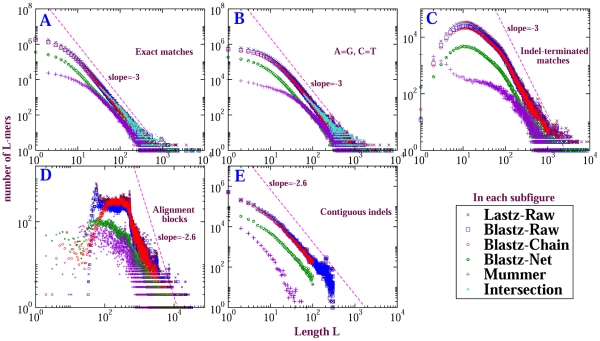
Figure 4. Length distributions of CMRs from self-alignment of mouse chromosome  computed by different methods.
Subfigures exhibit CMRs for different matching criteria. In contrast to the distribution for A = G,C = T matches, which is shifted significantly rightward from the exact matches, distributions for A = C,G = T and A = T,G = C matches differ inappreciably from exact matches; they are illustrated in Figure S2 .

