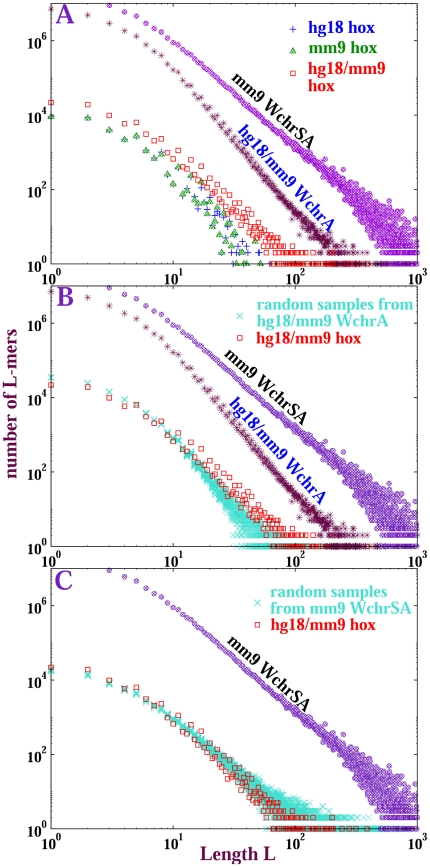
Figure 7. Length distributions of exact matches from Hox gene sequence alignments.
The reference distributions are: (1) mm9 WchrSA: self-alignment of all Hox gene-containing mouse chromosomes (chromosomes  ,
,  ,
,  and
and  ); (2) hg18/mm9 WchrA: hg
 -mm
-mm inter-species alignments among Hox gene-containing chromosomes only. Symbols in subfigures: Red squares (hg18/mm9 hox): Hox gene CMRs from hg18/mm9 alignment; Green triangles (mm9 hox): Hox gene CMRs from mm
 self-alignment; Blue pluses (hg18 hox): hox gene CMRs from hg18 self-alignment; Turquoise crosses: lay out of
  sequence sets, each randomly sampled from respective parent distributions: hg18/mm9 alignment in subfigure B and mm9 self-alignment in subfigure C. In all these random samples, Hox gene sequences have been excluded. Each sample contains the same total number of matched bases as Hox gene alignments from hg18/mm9 CMRs.

