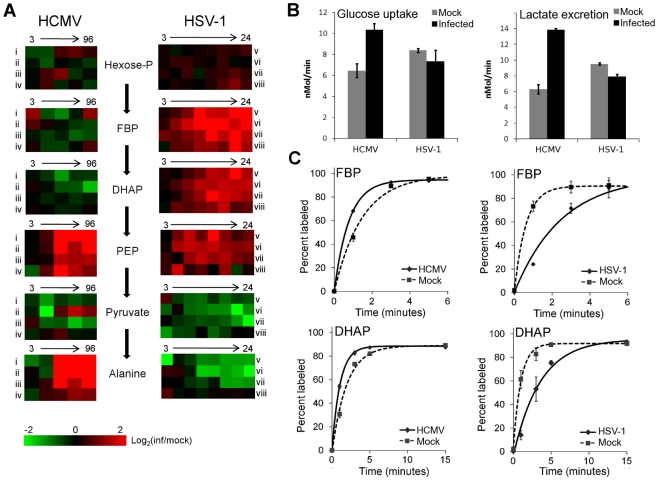
Figure 2. Perturbation of glycolysis by HCMV and HSV-1.
(A) Plots of individual metabolite abundance during HCMV and HSV-1 infection. Data are the same as presented in Figure 1. Metabolite concentrations are expressed relative to equivalent mock-treated cells. Rows correspond to infection time courses of the following virus strains and cell types: (i) TB40-HFF, (ii) AD169-HFF, (iii) AD169-MRC5, (iv) TB40-ARPE19, (v) F-HFF, (vi) KOS-HFF, (vii) KOS-MRC5, (viii) KOS-Vero. Columns correspond to time points: 3, 24, 48, 72, 96 hpi for HCMV and 3, 6, 9, 12, 15, 18, 21, 24 hpi for HSV-1 (Hexose-P: glucose-6-phosphate and its isomers; FBP: fructose-1,6-bisphosphate; DHAP: dihydroxy acetone-phosphate; PEP: phosphoenolpyruvate). (B) Measurement of glucose uptake and lactate excretion rates in HCMV-AD169 or HSV-KOS infected, as well as mock-treated, human foreskin fibroblasts (mean ±2 s.e.; n = 3). (C) Buildup of the labeled fraction of the FBP and DHAP pools after switching cells to uniformly 13C-labeled glucose medium at 12 hpi during HSV-KOS or 48 hpi during HCMV-AD169 infection or equivalent virus-free treatment of HFF cells. Symbols indicate experimental data points ±2 s.e.; n = 2; lines indicate exponential fit.

