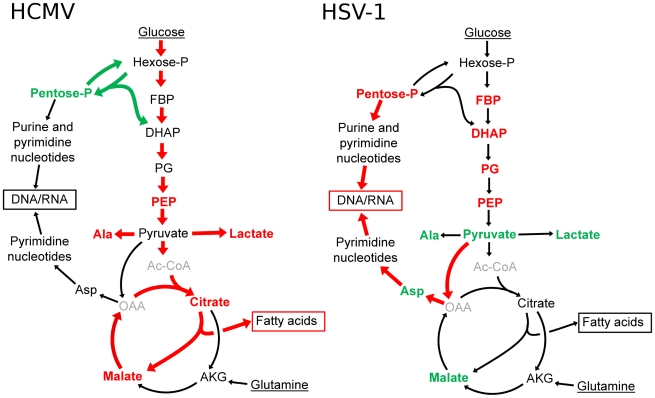
Figure 8. Divergent effects of HCMV and HSV-1 on central carbon metabolism.
Schematic summary of major metabolite concentration and flux changes in response to HCMV (left panel) and HSV-1 (right panel) infection of growth arrested fibroblasts. Arrow colors denote flux changes and font colors denote metabolite level changes relative to the mock-treated control (red-increased, green-decreased, grey-not detected). (Hexose-P: glucose-6-phosphate and its isomers, Pentose-P: ribose-phosphate and its isomers, FBP: fructose-1,6-bisphosphate, DHAP: dihydroxy acetone-phosphate, PEP: phosphoenolpyruvate, Asp: aspartate, Ala: alanine, Gln: glutamine, AKG: oxoglutarate, OAA: oxaloacetate, Ac-CoA: acetyl-coenzymeA.)

