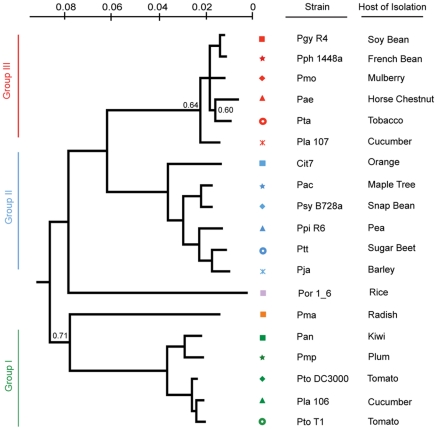
Figure 1. A Bayesian phylogeny of P. syringae strains with draft or complete genome sequences.
Phylogenetic analysis of the 19 strains included in this study based on nucleotide sequence of seven conserved loci. Bayesian posterior probabilities are displayed on the phylogeny only at nodes where these values are <0.95. For these unresolved notes, we used an independent phylogenetic approach on another 324 genes that confirmed that this tree captures the evolutionary history of these nodes (methods; Figure S2). Each phylogenetic group as defined in [16] was assigned its own color to the left of the phylogeny and strains were assigned symbols; this color and marker scheme continues throughout the figures. In all cases but one (Cit7; leaf surface of healthy Orange tree [95]) strains were isolated from diseased host plants listed at right.

