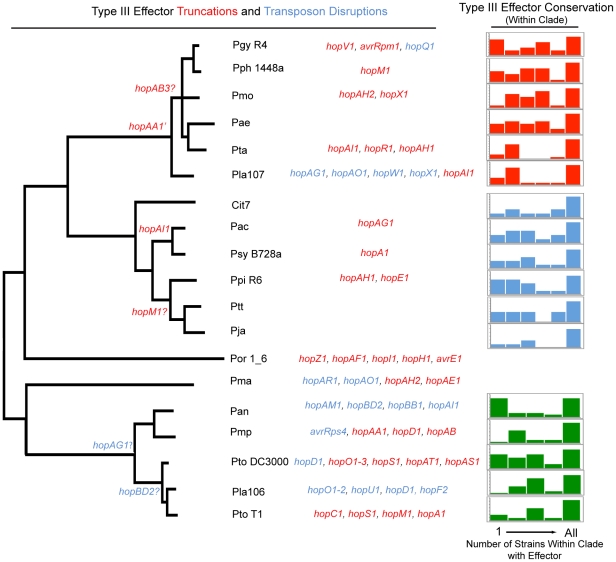
Figure 4. Phylogenetic conservation of disrupted and functional TTE proteins.
Parsimony was used to determine at which phylogenetic nodes TTE disruptions occurred according to the phylogeny in Figure 1. The gene names of TTEs that are truncated are displayed in red, while those that are disrupted by insertion sequence elements are in blue. TTE disruption events that could not be phylogenetically placed, and presumably occurred only in one strain, are listed to the left of the phylogeny. Question marks next to the TTE name indicate that there is conflicting information concerning disruption or disruptions that could not be verified. We include a disruption of hopF2 from Pla 106 because, even though the TTE sequence is complete, there is a transposon disruption in the shcF chaperone. At the far right, TTE conservation was determined for each genome within P. syringae groups where multiple strains were sequenced (groups I, II, III). The graph displays the percentage of each strain's TTE repertoire shared with other sequenced strains within an MLST group. The X-axis of this graph displays the number of potential strains within each MLST group that share particular TTEs with the genome of interest (max of 5 for group I and 6 for groups II and III). The percentage of singleton TTEs (found only within the strain of interest) is at the far left side of the graph, while the percentage of a strain's TTE repertoire conserved throughout the group is at the far right. The Y-axis represents the percentage of the TTE repertoire for each strain shared with other strains within the same MLST group and is scaled differently on each graph, however, the total area represented by each graph is 100% of the total effector repertoire for each strain.

