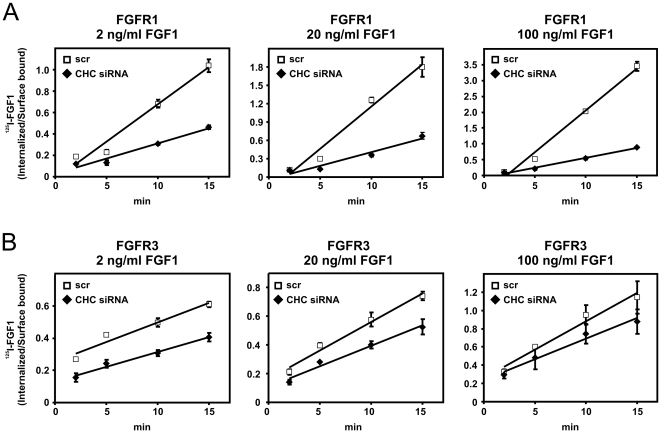
Figure 2. The effect of low and high concentrations of FGF1 on endocytosis in cells expressing FGFR1 or FGFR3 and depleted of clathrin heavy chain.
U2OS cells stably expressing FGFR1 (A) or FGFR3 (B) were transfected with siRNA oligos (100 nM) targeting CHC or a non-targeting siRNA control (scr), grown on gelatinized plates and incubated with 2, 20 or 100 ng/ml 125I-FGF1, 20 U/ml heparin and 0.2% gelatine at 37°C for indicated times. Internalized and surface-bound 125I-FGF1 were separated as described in Materials and Methods and the ratio was plotted as function of time. Note the different scale on the Y axis. The graph represents one independent experiment with three parallels ±s.d.

