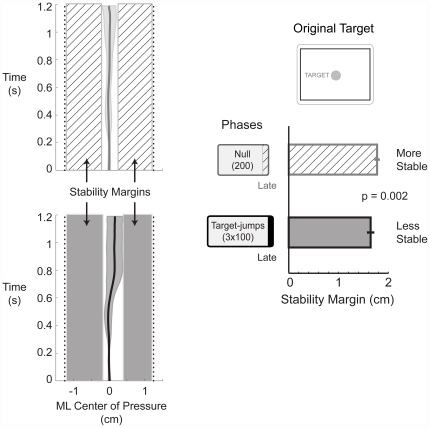
Figure 3. Maneuverability comes at the expense of stability.
Group averaged (n = 11) medio-lateral (ML) center of pressure time series profiles for late null (light gray) and late target-jump (dark gray). These conditions compared trials to the same target distance. Solid lines are group means and shaded areas are±s.d. The stability metric was the width of the stability margins which were larger for late null (diagonal hatch) compared to late target-jump (dark gray). Bars are the group means±s.e.m. of the stability margin for each time point.

