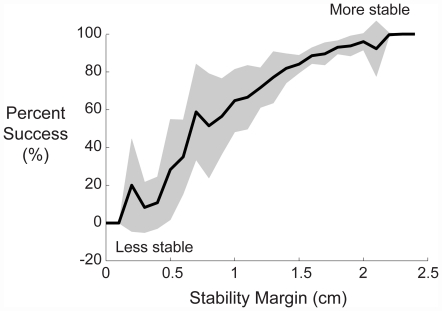
Figure 4. The percent of success and stability.
Percent of successful trials in 0.1 cm bins of stability margin across the width of the beam of support. Thick line is the mean and the shaded area is±s.d. Larger stability margins corresponded with higher probabilities of success and implied increased stability. Smaller stability margins corresponded with lower probabilities of success and implied decreased stability. These data support the definition of stability as the probability of keeping the board level and of stability margin as a metric of stability.

