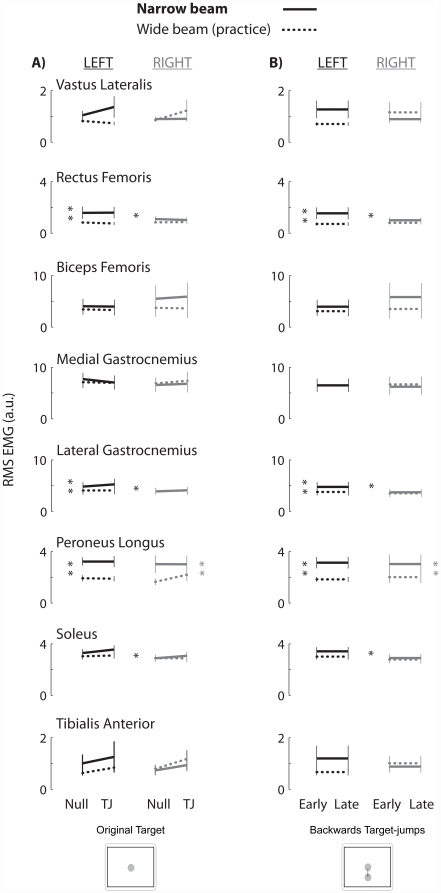
Figure 7. Group averaged RMS EMG amplitudes for all 16 lower limb muscles.
Thick lines are the narrow beam data while dotted lines are the wide beam data. Left muscles are black and right muscles are gray. Single asterisks indicate a significant increase in left muscle activity compared to the right muscle on the narrow board. Black double asterisks indicate a significant increase in muscle activity in the left muscle on the narrow beam compared to the wide beam board, while gray double asterisks indicate a significant increase in muscle activity in the right muscle. Error bars are standard error of the mean.

