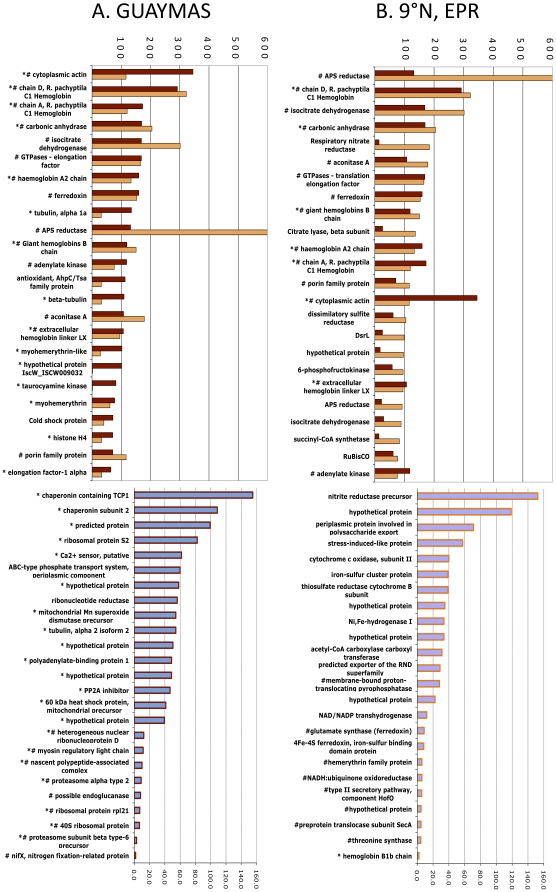
Figure 4. Changes in representation of proteins from East Pacific Rise (EPR) and Guaymas Riftia pachyptila trophosome.
Bar chart of 25 most abundant peptides organized by A) those most abundant in Guaymas tubeworms and B) those most abundant in EPR tubeworms. Pound signs denote proteins that were identified in both Guaymas and EPR Riftia symbiont proteomes, while asterisks denote those proteins that came solely from the host proteomes.

