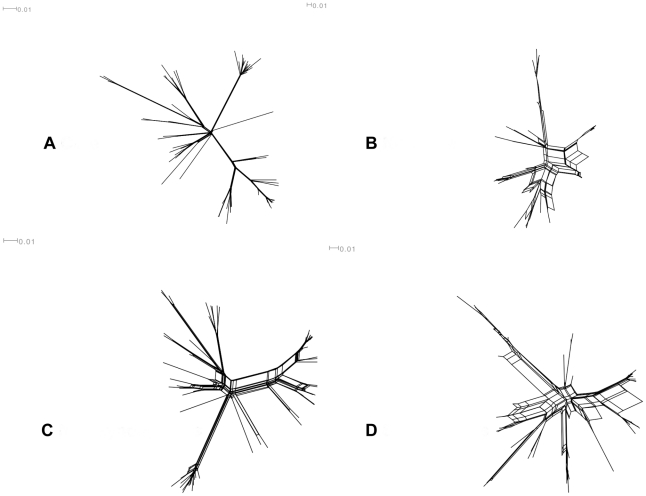
Figure 2. Neighbour-net networks constructed using Splits Tree 4.0.
Four subsets of the SNP data were used: A – synonymous and non-synonymous SNPs in the core, B – synonymous and non-synonymous SNPs present in the non-core, C – all non-synonymous SNPs, and D – all synonymous SNPs. Taxon labels were removed for the sake of clarity. Uncorrected p distances were used and the networks drawn using the equal angle method. The networks show extensive reticulation in B and D, but less in A and C. This is consistent with high rates of recombination in the non-core, relative to the core, and in synonymous SNPs as these are enriched in the non-core. The Phi test for detecting recombination, as implemented in Splits Tree, was also used on these subsets. This was highly significant for B and D (both p values<0.001) but not significant for A and C (both p values>0.1).

