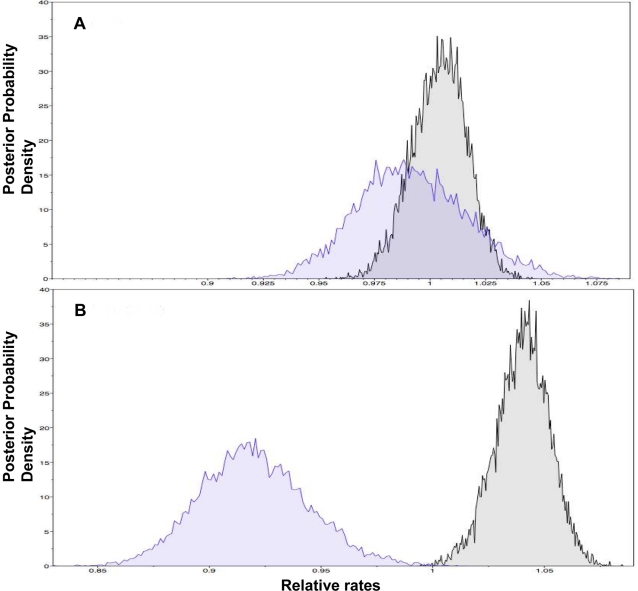
Figure 3. Posterior probability densities for the relative substitution rates.
Synonymous and non-synonymous SNPs were considered for the core (A) and non-core (B). One partition contained only non-synonymous SNPs (blue), whereas the other contained synonymous SNPs (grey). In the core data set (A) the synonymous partition (mean = 1.0041; 95% CI 0.9797–1.0281) is not significantly different from the non-synonymous partition (mean = 0.9918; 95% CI 0.9438–1.0407), although the former is slightly higher. In contrast, for the non-core data set (B) the relative rate for synonymous partition (mean = 1.0401; 95% CI 1.0159–1.0635) is significantly higher than the non-synonymous partition (mean = 0.9199; 95% CI 0.8731–0.9681).

