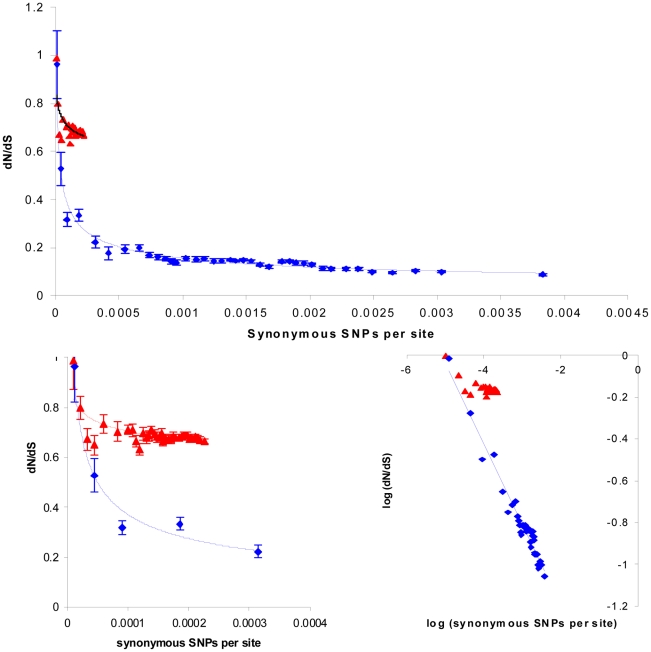
Figure 4. The time dependence of dN/dS in the core and non-core genome.
We calculated this ratio over all 1953 pairwise strain comparisons separately for the two sets of genes. We also calculated, for each pairwise comparison, the number of synonymous SNPs per synonymous site as a measure of divergence. We divided the results into bins of 50 pairwise comparisons according to increasing divergence (i.e. the first bin corresponding to the 50 least diverged comparisons). For each bin we plotted the average dN/dS against the average divergence, with standard errors calculated form all 50 data points (main panel). The data for the core is shown in red, the non-core in blue. To clarify the plot for the core data, which is far less diverged than the non-core, we re-scaled the figure (bottom left) to include only the five most conserved non-core bins. The trajectory for the non-core data fits closely to a power law (R2 = 0.96) as shown by the linear relationship when both axes are log-transformed (bottom right).

