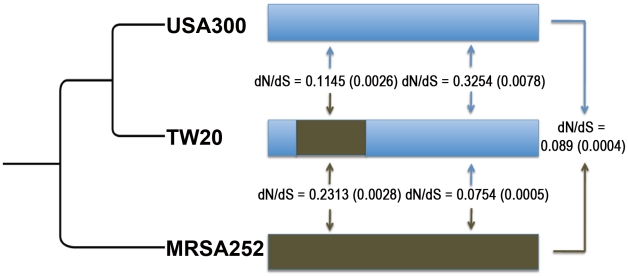
Figure 6. Mean dN/dS values are shown (with standard errors in parentheses) between S. aureus ST239 (TW20) and S. aureus USA300 (USA300), and between TW20 and S. aureus MRSA252 (MRSA252).
The brown section in TW20 depicts the large (635 kb) recombination event which originated from a close relative of MRSA252, the full genome is ∼3 Mb (not drawn to scale). On the left, the dendrogram illustrates the relationships between these strains.

