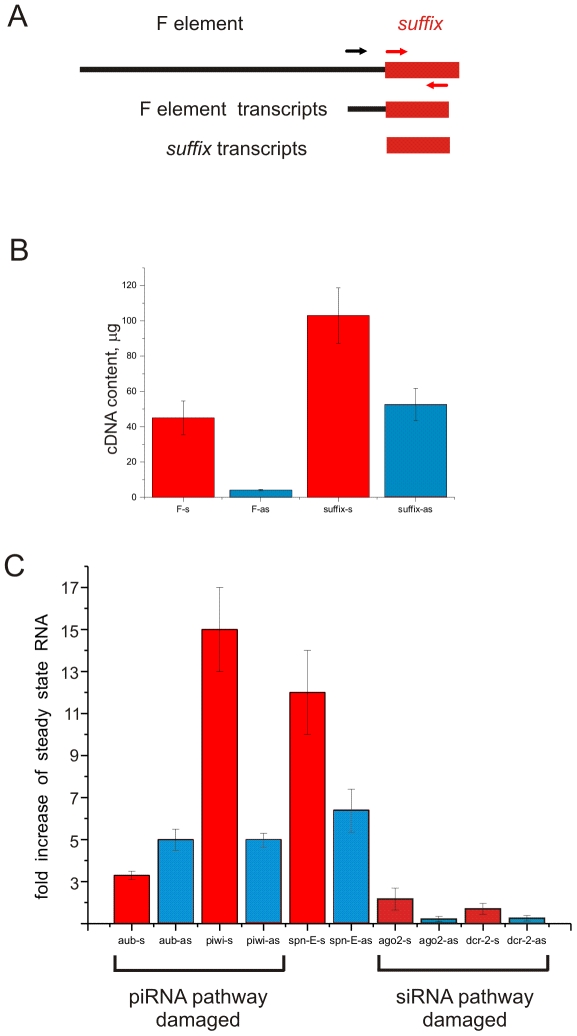
Figure 4. The levels of F element and suffix sense and antisense transcripts in Oregon R wild-type ovaries and accumulation of suffix transcripts in homozygous aub, piwi, spn-E, ago2 and dcr-2 Drosophila ovaries.
(A) A schematic presentation of relations between F element and suffix (not to scale) and primers used for RT-PCR to estimate F element and suffix transcripts. (B) Bars indicate amounts of sense and antisense transcripts corresponding to F element and suffix. (C) Bars indicate the ratio of suffix sense (red bars) or antisense (blue bars) transcripts in homozygous mutant fly ovaries compared to transcripts in the ovaries from wild-type flies. Transcript levels were normalized using rp49 mRNA levels. Error bars represent the data obtained in four parallel RT-PCR experiments.

