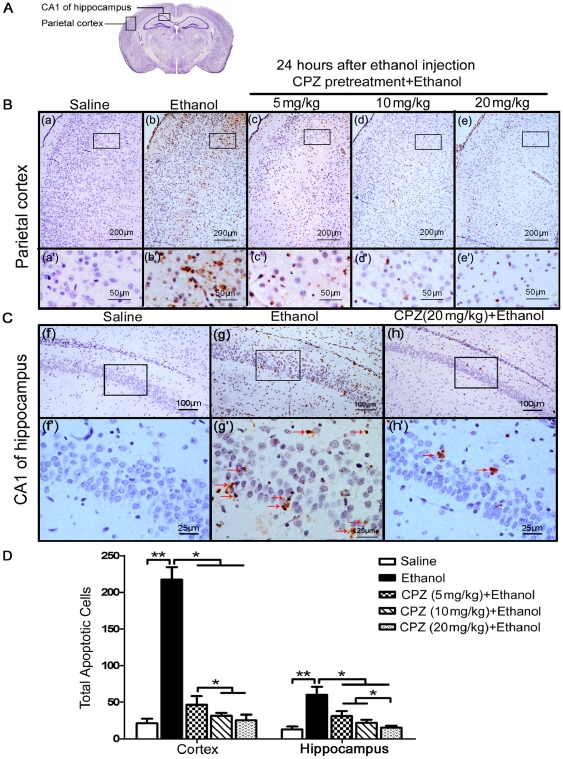
Figure 1. CPZ pretreatment reduces the number of apoptotic cells in rat brains after ethanol exposure.
(A) The diagram shows the cross section of the brain tissue, and the regions of the parietal cortex and CA1 of hippocampus are pointed out. (B and C) TUNEL-labeled brain sections showing regions including the parietal cortex and the CA1 region of the hippocampus (stratum pyramidale). These brain sections were obtained from the following treatment groups: Saline (a, a', f and f'), Ethanol (b, b', g and g'), and CPZ pretreatment at doses of 5 mg/kg (c, c'), 10 mg/kg (d, d') and 20 mg/kg (e, e', h and h'). The apoptotic cells with brown nuclear staining could be observed in the ethanol group and CPZ pretreatment + ethanol groups. Sections were counterstained with hematoxylin. (D) The total number of apoptotic cells throughout the whole cortex and the hippocampus of each specimen were counted in three separate experiments. Values are shown as means ± SEM. A Mann-Whitney U test for multiple comparisons revealed a significant difference between the ethanol treatment group and all other groups (**P<0.01, *P<0.05, n = 6–9 animals per group).

