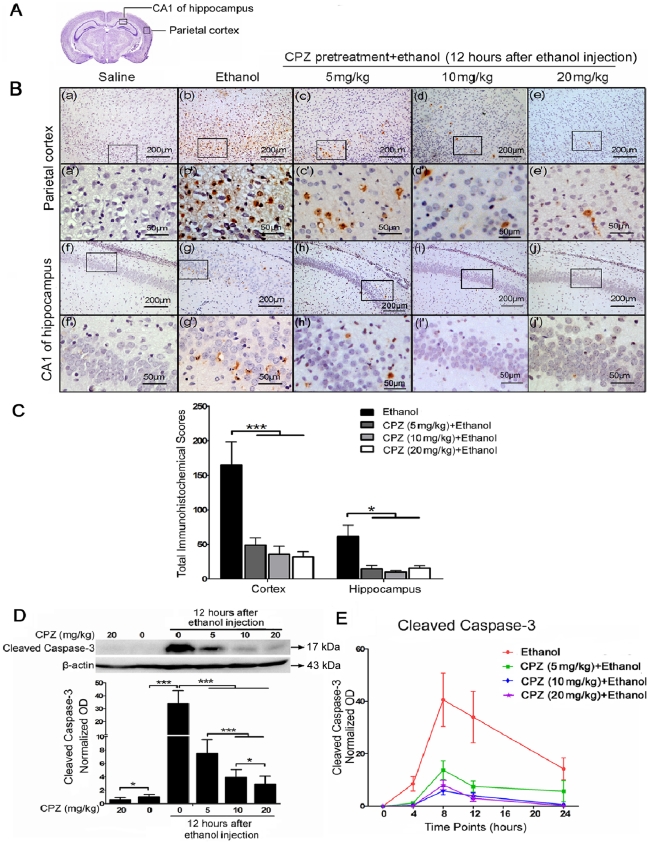
Figure 2. CPZ pretreatment inhibits cleaved caspase-3 expression in rat brains after ethanol exposure.
(A) The diagram shows the cross section of the cerebrum, and the regions of the parietal cortex and CA1 of hippocampus are pointed out. (B) Cleaved caspase-3 labeling corresponds to brown staining could be observed in the cytoplasm and nuclei. Sections were counterstained with hematoxylin. (C) Total scores for cleaved caspase-3 immunoreactivity were calculated, and all three doses of CPZ pretreatment significantly reduce cleaved caspase-3 expression in the following regions, compared with the ethanol group: cortex (***P<0.001; n = 5–7 animals per group) and hippocampus (*P<0.05; n = 5–7 animals per group). (D) The level of cleaved caspase-3 was analyzed by western blot from the whole brain taken 12 h after ethanol administration. β-actin was used as a loading control. Cleaved caspase-3 bands were measured using optical densitometry, and the data were normalized to a control sample (defined as 1.00). Values are shown as means±SEM. Mann-Whitney U test revealed a significant difference between the ethanol group and the CPZ pretreatment groups (***P<0.001, *P<0.05, n = 4 animals per group). (E) The curves show cleaved caspase-3 levels in the ethanol and CPZ pretreatment groups at different time points (4 h, 8 h, 12 h and 24 h) after ethanol exposure. All three doses of CPZ result in a significant decrease of the cleaved caspase-3 levels compared with ethanol group.

