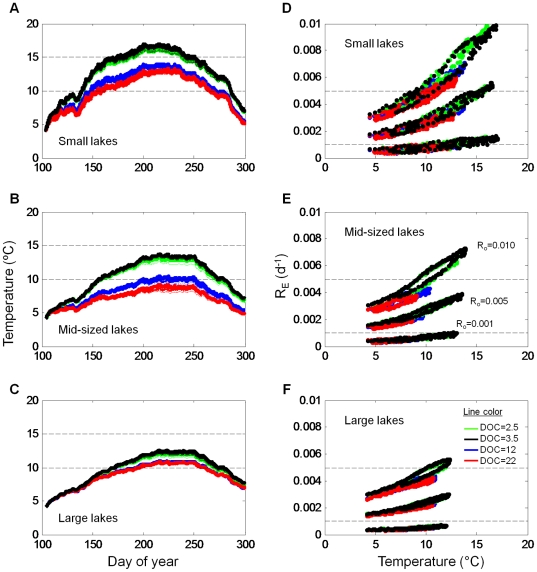
Figure 5. The relationship between lake temperature and RE.
(A–C) Mean lake temperature through time. Each lake has four different DOC conditions. Dashed lines are at 10°C and 15°C to allow for easier visual comparison among panels. (D–F) RE versus temperature. Each lake has three different R0, which tend to cluster together, and within each cluster are four different DOC conditions. Dashed lines are at R0 values. Lake sizes are the same as in Fig. 4.

