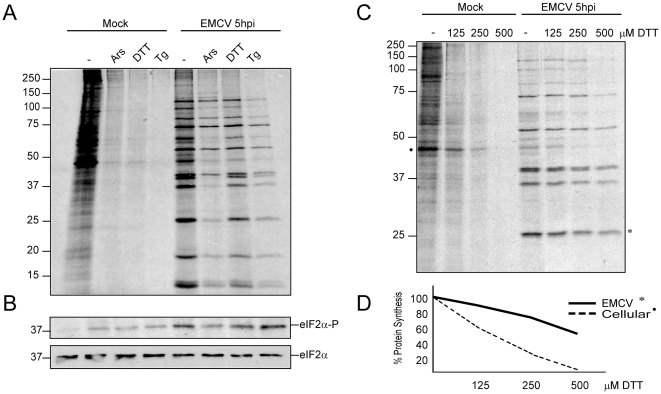
Figure 1. Effect of different inducers of eIF2α phosphorylation on cellular and EMCV translation.
A) MEFs were mock- or EMCV-infected at 10 pfu/cell. Cells were subsequently pre-treated with 200 µM arsenite (Ars), 400 µM DTT, or 1 µM thapsigargin (Tg) for 15 min and then labelled for 45 min with [35S]Met-Cys in presence of the same compounds. Samples were submitted to SDS-PAGE, fluorography and autoradiography. B) Western blot analysis of eIF2α and phosphorylated eIF2α using the same samples as in panel A and antibodies anti-phospho-eIF2α (1∶1000 dilution) and anti-eIF2α (1∶1000 dilution). C) MEFs mock- or EMCV-infected at 10 pfu/cell were pre-treated for 15 min with 0, 125, 250 or 500 µM DTT and then labelled for 45 min with [35S]Met-Cys in presence of the same amounts of DTT. Samples were then collected and submitted to SDS-PAGE, fluorography and autoradiography. D) Cellular and viral protein synthesis examined by densitometric analysis of the autoradiograph shown in panel C. The protein bands analyzed are indicated by an asterisk.

