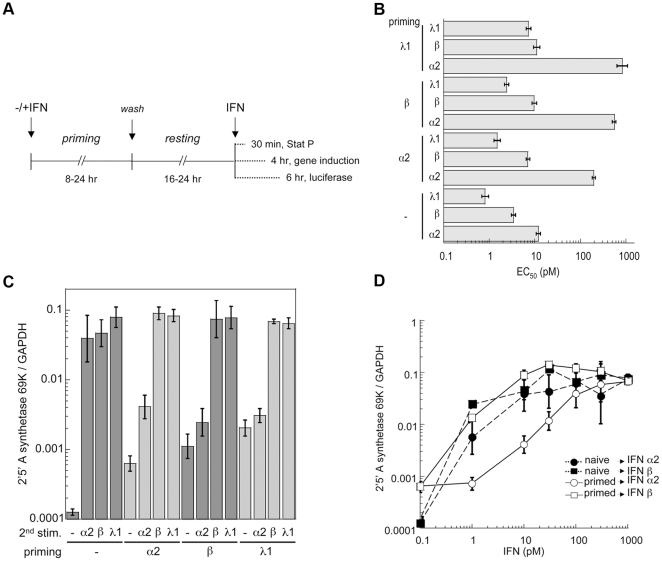
Figure 1. Differential desensitization studies in HLLR1-1.4 cells.
(A) Protocol used to measure desensitization. Unless otherwise indicated, cells were primed with IFN α2 or IFN β (500 pM) or IFN λ1 (50 pM). The priming phase varied between 8 and 24 hr and the resting phase between 16 and 24 hr. Cells were then challenged with IFN for different times depending of the read out. (B) Graphic representation of the EC50 (pM) as determined by the luciferase activity induced by IFN α2, IFN β or IFN λ1 in naïve or primed cells. EC50 were calculated from the non-linear regression fits of the luciferase activity induced by IFN in a concentration range covering 2.4 log. Priming and resting times lasted 24 hr each. Bars represent the 95% confidence limits. (C) Level of OAS-69K mRNA induced by IFN α2 (10 pM), IFN β (10 pM) or IFN λ1 (50 pM) in naïve and primed cells as determined by RT-qPCR. Data are expressed as ratios to GAPDH levels. Priming and resting times lasted 24 hr each. Bars represent the 95% confidence limits (Student's t-test). (D) Dose response induction profile of OAS-69K mRNA in naïve (closed symbols) and IFN α2 primed cells (open symbols) stimulated for 4 hr with different doses of IFN α2 (circles) or IFN β (squares) as determined by RT-qPCR. Priming and resting times lasted 24 hr each. Data are expressed as ratios to GAPDH levels. Bars represent the 95% confidence limits (Student's t-test).

