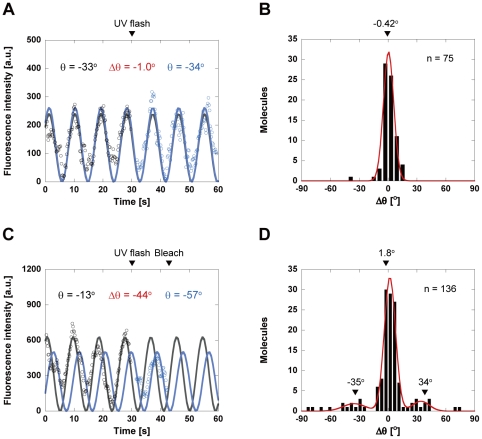
Figure 4. Time trajectories of the fluorescence intensity and calculated fluorophore angles.
(A, C) Time trajectory of BSR intensity in the absence (A) and presence of caged ATP (C). The UV flash occurred at 30 s (arrow). The trajectories of BSR intensities after subtracting the background signals were averaged over every five frames, and fitted to a quadratic cosine function (solid lines). Black, fluorescence intensity before UV flash; blue, fluorescence intensity after UV flash. (B, D) Distributions of Δθ in the absence (B) and presence of caged ATP (D). Positive angle, angular displacement measured counterclockwise; negative angle, angular displacement measured clockwise. In the absence of caged ATP (B), the distribution corresponded to a Gaussian distribution with a peak of −0.42°. In the presence of caged ATP (D), the distribution can be fitted by a sum of three Gaussian functions, with peaks of 1.8°, 34°, and −35°.

