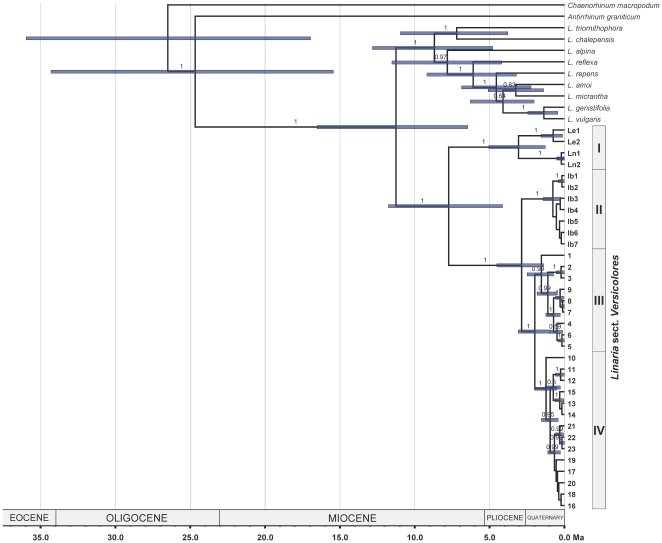
Figure 2. Molecular dating analysis.
Maximum clade credibility tree produced by relaxed molecular-clock analysis of rpl32-trnL UAG and trnK-matK sequences in BEAST, excluding sequence identities of Linaria sect. Versicolores and the outgroup. Node bars represent the 95% highest posterior density intervals for the divergence time estimates of clades with posterior probabilities above 0.50. Values above branches indicate Bayesian posterior probabilities. Major clades of the study group are indicated.

