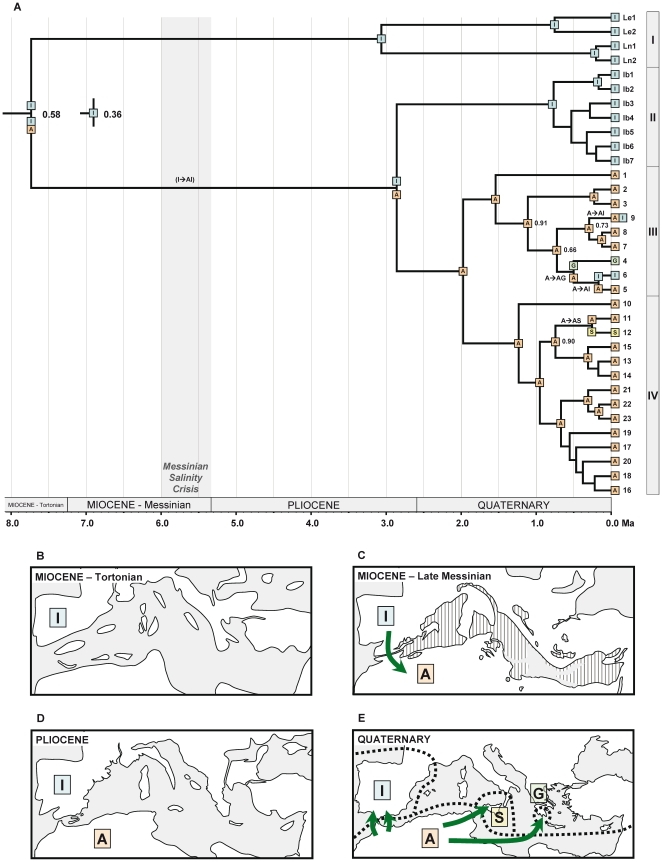
Figure 3. Hypothesis of colonization history based on DEC analysis.
(A) Biogeographic reconstruction based on dispersal-extinction-cladogenesis modelling implemented in Lagrange using the single MCC tree from the BEAST analysis (Fig. 2) after pruning outgroup taxa. Coloured squares represent maximum-likelihood range inheritance scenarios reconstructed under model M3 for nodes with PP above 0.5. Ranges inherited from widespread ancestors following cladogenesis are shown at the base of diverging branches, while single-area ancestral ranges are shown at nodes. Inferred events of dispersal along branches are also illustrated. When a node has alternative scenarios within 2 log-likelihood units of the optimal reconstruction, the relative probability (fraction of the global likelihood) for the optimal reconstruction is indicated. Given the relevance of the root node for the early colonization history of the group, the two alternative reconstructions are displayed, and the dispersal event inferred under the second best scenario (relative probability 0.36) is shown in brackets along the branch leading to subsect. Versicolores. (B–D) Hypothesis of colonization history of Linaria sect. Versicolores across the Mediterranean basin since the Late Miocene, based on phylogenetic, dating and biogeographic reconstruction results, as well as geological information. Coloured squares represent the range occupied by the group during each period, and arrows indicate hypothetical colonization events. Paleogeographic maps are based upon [77] (white – emerged areas; grey – submerged areas; lined – desiccating areas). Areas delimited for reconstructions are displayed in E. I – Iberian Peninsula; A – northern Africa; S – Sicily; G – Greece.

