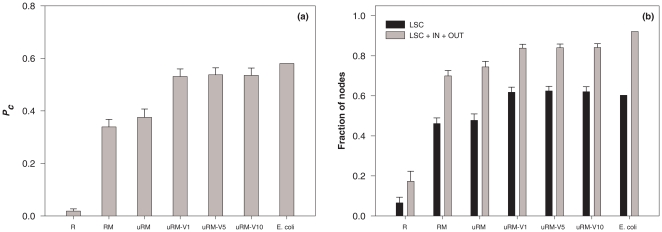
Figure 5. Graph-based characteristics of the metabolic networks in the different ensembles.
(a) Probability PC that a path exists between two nodes taken at random in the directed metabolite-metabolite graph. (b) Fraction of nodes belonging to the largest strong component (LSC) or to the union of LSC, IN and OUT components. Different bars from left to right correspond to network ensembles incorporating an increasing number of constraints and the last bar corresponds to the E. coli metabolic network. The standard deviation is also displayed for each ensemble.

