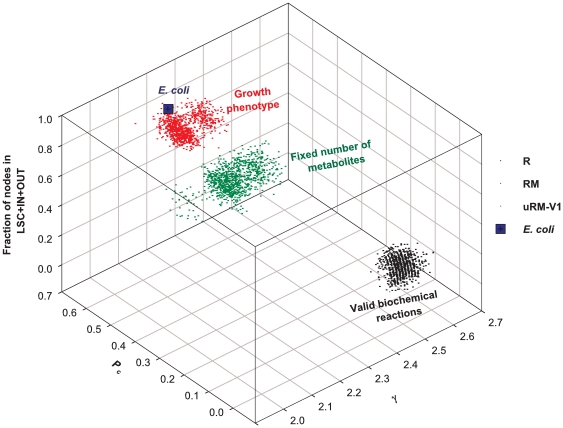
Figure 6. Synthetic view of the statistical properties of randomized networks in different ensembles and comparison to the E. coli metabolic network.
The three axes are associated with graph characteristics of the networks. PC is the probability that a path exists between two nodes. γ is the exponent of the power law fit to the metabolite degree distribution. The vertical axis is the fraction of nodes in the union of LSC, IN and OUT components. Each cloud represents 1000 randomized networks in the ensemble considered.

